Composite Score
Five metrics describe different dimensions of palette quality. The composite score aggregates them into a single number for comparison.
The Formula
SCORE = 100 × (η × L × Sc × H × U)^(1/5)Where each term is a metric normalized to [0, 1]:
| Symbol | Metric |
|---|---|
| η | Contrast Efficiency |
| L | Lightness Linearity |
| Sc | Chroma Smoothness |
| H | Hue Stability |
| U | Spacing Uniformity |
A small constant ε = 10⁻⁶ is added to each metric before multiplication to prevent numerical issues when any metric is exactly zero. The result is guaranteed to lie in [0, 100].
Why Geometric Mean
The score uses geometric mean, not arithmetic average. The difference matters.
Arithmetic mean of [1.0, 1.0, 1.0, 1.0, 0.2] = 0.84 → score 84. Geometric mean of the same values = 0.725 → score 72.
With arithmetic mean, a palette that excels at four metrics but fails at one scores 84 — the failure is averaged away. With geometric mean, it scores 72 — the failure is preserved.
This is intentional. A palette with poor chroma smoothness doesn't become usable because its hue stability is excellent. All five dimensions affect every component in the system simultaneously. No single metric can compensate for a structural flaw in another.
Three Properties
Strong penalty for imbalance — a single poor metric significantly reduces the overall score. A palette with one metric at 0.5 and four at 1.0 scores 87, not 90.
Encouragement of uniform quality — the highest scores come from palettes that perform consistently across all five dimensions, not from excellence in one area.
Scale invariance — since all metrics are bounded in [0, 1], their relative contributions are preserved regardless of absolute values.
Reading the Score
| Range | Meaning |
|---|---|
| 85–100 | All five metrics performing well. Palette is dense, perceptually even, structurally consistent. |
| 70–85 | One or two metrics notably weaker. Inspect individual scores to find the issue. |
| < 70 | Structural problem. At least one metric is significantly degraded — expect visible artifacts or maintenance overhead. |
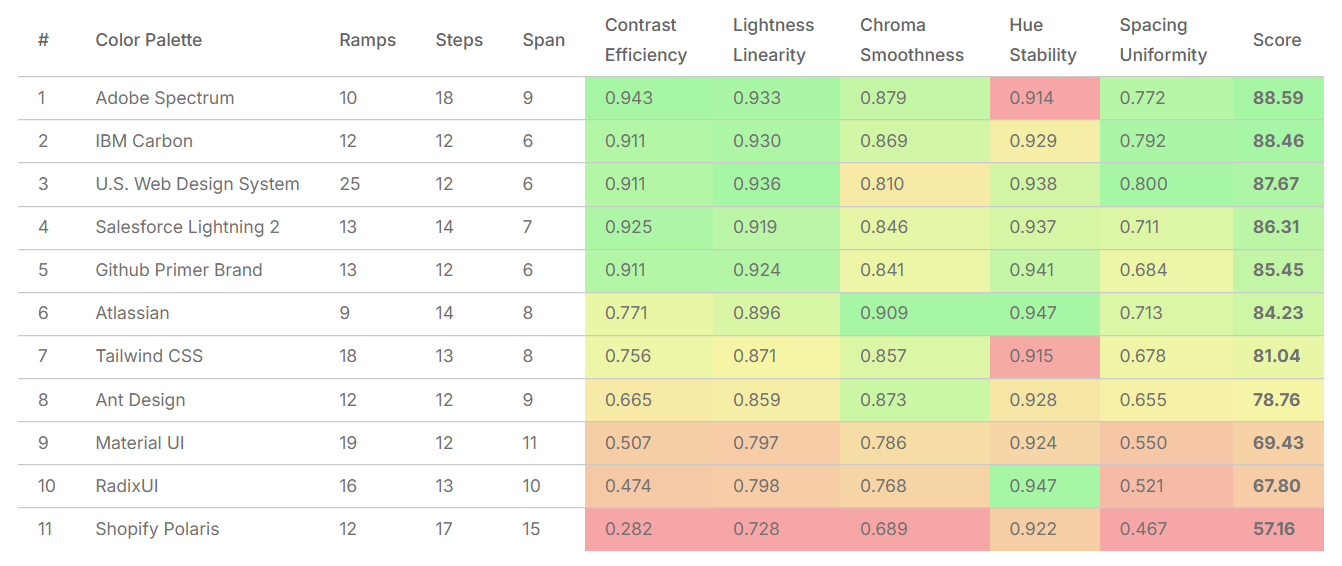
Real-world benchmarks across 11 industry design systems range from 57 to 88, confirming the score differentiates meaningfully across systems built by large teams with real production constraints.
The Score Is Not a Taste Test
The composite score does not measure whether a palette looks good. It measures whether a palette is structurally sound for use in a design system:
- Can it deliver accessible contrast without exhausting the palette range?
- Does it progress evenly in perceived lightness?
- Is the saturation curve smooth?
- Does the hue stay consistent?
- Are perceptual steps uniform?
A palette can score 90 and look unexciting. A palette can score 60 and look beautiful in a Figma swatch grid. The score predicts how the palette behaves under the full load of a production design system — not how it looks in isolation.